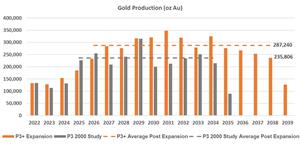
Gold Production (oz Au)
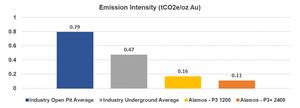
Emission Intensity (tCO2eoz Au)
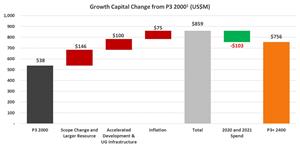
Growth Capital Change from P3 2000 (US$M)
TORONTO, June 28, 2022 (GLOBE NEWSWIRE) -- Alamos Gold Inc. (TSX:AGI;
NYSE:AGI) (“Alamos” or the “Company”) today reported results of the Phase 3+ Expansion Study (“P3+
Expansion Study”) conducted on its Island Gold mine, located in Ontario, Canada. The P3+ Expansion Study outlines a
larger, more profitable, and valuable operation than outlined in the Phase III Expansion Study released in 2020 (“P3
2000 Study"). Based on the results of the P3+ Expansion Study, the Company is proceeding with an expansion of the
operation to 2,400 tonnes per day (“tpd”).
The P3+ Expansion Study has been updated to reflect the current costing environment. All economics, costs and
capital referenced in this release for the previous P3 2000 Study are based on estimates as of 2020 and do not
reflect industry-wide cost and capital inflation since that time. All amounts are in United States dollars, unless
otherwise stated.
Phase 3+ Expansion Study Highlights:
Higher production: average annual gold production of 287,000 ounces starting in 2026 upon completion of the
shaft
- This represents a 22% increase from the P3 2000 Study and a 121% increase from the mid-point of 2022 production
guidance of 130,000 ounces
Industry low costs: consistent cost structure with the P3 2000 Study, with productivity gains and economies
of scale offsetting inflation
-
Average total cash costs of $432 per ounce (average $425 per ounce from 2026), consistent with
the P3 2000 Study and 25% lower than the mid-point of 2022 guidance of $575 per ounce
-
Average mine-site all-in sustaining costs of $610 per ounce (average $576 per ounce from 2026), a
30% decrease from the mid-point of 2022 guidance of $875 per ounce
Larger, longer-life operation supported by significantly increased Mineral Reserve and Resource
- 43% increase in mineable resource to 4.6 million ounces of gold grading 10.59 grams per tonne (“g/t Au”)
- 18 year mine life to 2039, a four year increase from the P3 2000 Study, while operating at 20% higher production
rates of 2,400 tpd
Lower capital intensity: lower total capital per ounce over the life of mine
- Growth capital of $756 million and sustaining capital of $777 million, both up from the P3 2000 Study reflecting
the expansion, a larger mineable resource, and industry-wide inflation
- Total capital intensity decreased 4% to $344 per ounce reflecting the larger mineable resource with increased
ounces per vertical metre driving the lower capital intensity and contributing to the stronger economics
- $100 million of the increase in growth capital compared to the P3 2000 Study reflects sustaining capital that
has been brought forward to the expansion period for accelerated underground development and infrastructure to
support the higher mining rate
- Expansion significantly de-risked given increased detailed engineering, capital committed and projects completed
to date, including the majority of earthworks
Stronger economics with expansion and larger mineable resource more than offsetting inflation to create a
more valuable operation
-
After-tax net present value (“NPV”) (5%) of $1.6 billion, a 25% increase from the P3 2000 Study
(base case gold price assumption of $1,650 per ounce and USD/CAD foreign exchange rate of $0.78:1)
-
After-tax internal rate of return (“IRR”) of 23%, up from 20% in P3 2000 Study
-
After-tax NPV (5%) of $2.0 billion, a 31% increase from the P3 2000 Study, and an after-tax IRR of 25%, at
current gold prices of $1,850 per ounce
Industry low Greenhouse Gas (“GHG”) emission intensity
- 35% reduction in life of mine GHG emissions relative to the current operation, supporting the company-wide
target of a 30% reduction in GHG emissions by 2030
- 31% additional reduction in emissions per ounce of gold produced from industry low levels
Fully funded, balanced approach to growth: growing free cash flow expected starting in the second half of
2022
- With no significant capital expected to be spent on Lynn Lake until the P3+ Expansion is well underway; the
Company is well positioned to fund the expansion internally while generating strong free cash flow over the next
several years
- The Company expects significant free cash flow growth in 2025 and beyond as production rates ramp up at Island
Gold
“Island Gold continues to grow in every sense with our planned Phase 3+ Expansion driving the value of Island Gold
to $2 billion at current gold prices. Mineral Reserves and Resources have increased to 5.1 million ounces,
supporting the Phase 3+ increase in production rates, which will create a bigger, longer-life, more profitable and
valuable operation. As a producing mine with a well-understood cost structure, this expansion is low risk from an
execution perspective, and has a significantly reduced carbon footprint. The exploration story continues to unfold
with a Mineral Reserve and Resource base that has nearly tripled over the past four years, and with the deposit open
laterally and down-plunge, we expect Island Gold will be one of the lowest cost and most profitable mines for
decades to come,” said John A. McCluskey, President and Chief Executive Officer.
|
Phase 3+ Expansion Study Highlights
|
Phase 3 Expansion
4
(as of January 2020)
|
Phase 3+ Expansion
(as of January 2022)
|
|
Production
|
|
|
| Mine life
(years) |
16 (to 2035) |
18 (to 2039) |
|
Project/Expansion completion date |
Q2 2025 |
Q1 2026 |
| |
|
|
| Total gold
production (000 ounces) |
3,104 |
4,460 |
| |
|
|
| Average
annual gold production – life of mine (000 ounces) |
201 |
255 |
| Average
annual gold production – post project (000 ounces) |
236 |
287 |
|
|
|
|
| Total mill
feed (000 tonnes) |
9,572 |
13,550 |
| |
|
|
| Average
gold grade (grams per tonne) |
10.45 |
10.59 |
| |
|
|
| Recovery
(%) |
96.5% |
96.5% |
| |
|
|
| Average
mill throughput (tpd) |
2,000 |
2,400 |
|
|
|
|
|
Operating Costs
|
|
|
| Total cost
per tonne of mill feed1 (C$) |
$184 |
$178 |
|
|
|
|
| Total cash
cost – life of mine (per ounce sold)2,6 |
$443 |
$432 |
| Total cash
cost – post project (per ounce sold)2,6 |
$422 |
$425 |
| Mine-site
all-in sustaining cost – life of mine (per ounce sold)2,6 |
$627 |
$610 |
| Mine-site
all-in sustaining cost – post project (per ounce sold)2,6 |
$559 |
$576 |
|
|
|
|
|
Capital Costs (millions)
|
|
|
| Growth
(project) capital expenditure |
$538 |
$756 |
| Sustaining
capital expenditure |
$576 |
$777 |
| Total
capital expenditure – life of mine |
$1,114 |
$1,533 |
| Total
capital expenditure (per ounce produced) – life of mine6 |
$359 |
$344 |
| Total
all-in cost (per ounce produced) – life of mine5,6 |
$802 |
$776 |
|
|
|
|
Base Case Economic Analysis: $1,650 per ounce Gold Price
(USD/CAD foreign exchange rate of $0.78:1)
|
|
|
| IRR vs
current 1,200 tpd operation (after-tax)3 |
20% |
23% |
| |
|
|
| NPV @ 0%
discount rate (millions, after-tax) |
$2,057 |
$2,786 |
| NPV @ 5%
discount rate (millions, after-tax) |
$1,303 |
$1,632 |
| |
|
|
Economic Analysis at $1,850 per ounce Gold Price
(USD/CAD foreign exchange rate of $0.78:1)
|
|
|
| IRR vs
current 1,200 tpd operation (after-tax)3 |
22% |
25% |
| |
|
|
| NPV @ 0%
discount rate (millions, after-tax) |
$2,416 |
$3,365 |
| NPV @ 5%
discount rate (millions, after-tax) |
$1,533 |
$2,004 |
|
|
|
|
1. Total unit cost per tonne (“t”) of ore includes royalties and silver as a by-product credit
2. Total cash
costs and mine-site all-in sustaining costs include royalties and silver as a by-product credit
3. The IRR is
calculated on the differential after-tax cash flow between the expansion scenarios and continuing to mine at 1,200
tpd with ramp access and with a paste fill plant
4. The 2020 P3 2000 Study has been normalized to the P3+
Expansion using a gold price of $1,800/oz and USD/CAD foreign exchange rate of $0.79:1 from 2020-2022; and gold
price of $1,650/oz and USD/CAD foreign exchange rate of 0.78:1 2023 onward
5. Total all-in cost per ounce
produced is calculated as total cash cost per ounce plus total capital per ounce produced over the life of
mine
6. Please refer to the Cautionary Notes on non-GAAP Measures and Additional GAAP Measures
Mineable Resource
A mineable resource totaling 13.6 million tonnes, grading 10.59 g/t Au containing 4.6 million ounces of gold has
been included in the Phase 3+ Expansion Study. This represents a 43% increase from the P3 2000 Study reflecting the
significant growth in Mineral Reserves and Resources since 2020. The P3+ Expansion Study incorporates Mineral
Reserves and approximately 87% of Measured and Indicated and Inferred Mineral Resources as of December 31, 2021.
Mineral Resources included in the P3+ Expansion Study had stoping outlines applied and then were assigned Island
Gold’s standard zonal dilution and recovery rates. Stopes were evaluated against applicable cut-off grades and a
mine design and sequence was generated. The inclusion of 87% of the Mineral Resource is conservative relative to the
historical conversion rate of Inferred Mineral Resource to Mineral Reserve, which has averaged over 100% since 2016.
This also reflects the high degree of confidence in the quality of the Mineral Resource which is part of the same
structure as Mineral Reserves with a consistent style of mineralization.
Mineable Resource as of December 31, 2021
|
|
December 31, 2021
|
Undiluted Resource Used in Phase 3+ Study
|
Diluted & Recovered Resource Used in Phase 3+ Study
|
|
|
Tonnes
(000)
|
Grade
(g/t Au)
|
Ounces
(000)
|
Tonnes
(000)
|
Grade
(g/t Au)
|
Ounces
(000)
|
Tonnes
(000)
|
Grade
(g/t Au)
|
Ounces
(000)
|
|
Mineral Reserves
|
|
|
|
|
|
|
|
|
|
|
Proven |
834 |
9.33 |
250 |
|
|
|
834 |
9.33 |
250 |
| Probable
|
3,278 |
10.33 |
1,088 |
|
|
|
3,278 |
10.33 |
1,088 |
|
Total Reserves |
4,112 |
10.12 |
1,338 |
|
|
|
4,112 |
10.12 |
1,338 |
|
Mineral Resources
|
|
|
|
|
|
|
|
|
|
| Measured
|
20 |
4.92 |
3 |
19 |
4.92 |
3 |
21 |
4.11 |
3 |
| Indicated
|
1,076 |
8.18 |
283 |
991 |
8.18 |
261 |
1,128 |
6.83 |
248 |
| Total
Measured & Indicated |
1,096 |
8.12 |
286 |
1,010 |
8.12 |
264 |
1,149 |
6.78 |
251 |
| Inferred
|
7,906 |
13.59 |
3,454 |
7,283 |
13.59 |
3,182 |
8,289 |
11.34 |
3,023 |
| |
|
|
|
|
Phase 3+ Mill Feed
|
13,550
|
10.59
|
4,612
|
Economic Analysis
The Phase 3+ Expansion has an estimated base case after-tax NPV (5%) of $1.6 billion and after-tax IRR of 23%
assuming a gold price of $1,650 per ounce and USD/CAD foreign exchange rate of $0.78:1.
Assuming an $1,850 per ounce gold price, the after-tax NPV (5%) increases to $2.0 billion and after-tax IRR
increases to 25%. The mine plan, operating parameters and capital estimates incorporated in the P3+ Expansion Study
are effective January 1, 2022. The project economics are sensitive to metal price assumptions and input costs as
detailed in the tables below.
Phase 3+ Expansion After-Tax NPV (5%) Sensitivity ($ Millions)
|
|
-10
%
|
-5
%
|
Base Case
|
5
%
|
10
%
|
|
Gold Price |
$1,324 |
$1,479 |
$
1,632
|
$1,785 |
$1,939 |
|
Canadian Dollar |
$1,772 |
$1,702 |
$
1,632
|
$1,562 |
$1,491 |
|
Capital Costs |
$1,723 |
$1,678 |
$
1,632
|
$1,587 |
$1,541 |
|
Operating Costs |
$1,716 |
$1,674 |
$
1,632
|
$1,590 |
$1,548 |
Phase 3+ Expansion After-Tax NPV (5%) and IRR Sensitivity to Gold Price
|
|
After tax NPV 5% (US$M)
1
|
IRR (%)
2
|
|
Gold price
|
P3+ 2400
|
P3 2000
3
|
P3+ 2400
|
P3 2000
3
|
|
$
1,450
|
$
1,258
|
$1,072 |
20
%
|
17% |
|
$
1,550
|
$
1,446
|
$1,187 |
22
%
|
18% |
|
$
1,650
|
$
1,632
|
$1,303 |
23
%
|
20% |
|
$
1,750
|
$
1,818
|
$1,418 |
24
%
|
21% |
|
$
1,850
|
$
2,004
|
$1,533 |
25
%
|
22% |
|
$
1,950
|
$
2,189
|
$1,648 |
26
%
|
23% |
1 NPV and IRR are calculated for life of mine starting January 2022
2 IRR is calculated on
the differential after-tax cash flow between the respective expansion scenarios and the base case of continuing to
mine at 1,200 tpd with ramp only access
3 The 2020 Phase 3 Expansion Study (P3 2000) has been
normalized to the P3+ Expansion using a gold price of $1,800/oz and USD/CAD foreign exchange rate of $0.79:1 from
2020-2022; and gold price of $1,650/oz and USD/CAD foreign exchange rate of 0.78:1 2023 onward
Phase 3+ Expansion Overview
The Phase 3+ Expansion to 2,400 tpd from the current rate of 1,200 tpd will involve various infrastructure
investments. These include the installation of a shaft, paste plant, and an expansion of the mill. This
infrastructure was all incorporated into the P3 2000 Study with several scope changes to accommodate the 20%
increase in production rates to 2,400 tpd including a larger mill expansion and paste plant, as well as accelerated
development to support the higher mining rates. The Phase 3+ Expansion also includes 30% more development over the
mine life to accommodate the 43% larger mineable resource.
Following the completion of the expansion in 2026, the operation will transition from trucking ore and waste to
skipping ore and waste to surface through the new shaft infrastructure, driving production higher and costs
significantly lower.
The completion of the shaft is expected in Q1 2026, compared to Q2 2025 in the P3 2000 Study which is attributable
to a delay in the receipt of the Closure Plan Amendment (“CPA”). The CPA was received in March 2022 allowing for the
ramp up of construction activities. This delay has been offset by an optimized mine plan which will access higher
grades sooner such that total production between 2023 and 2025 is consistent under both plans.
A chart accompanying this announcement is available at https://www.globenewswire.com/NewsRoom/AttachmentNg/42bbd1c7-44a3-4a17-a775-33d87a7f8ef3
Project Significantly De-Risked Given Level of Detailed Engineering & Progress to Date
Design engineering and costing for the majority of the Phase 3+ Expansion was completed to a feasibility level
providing increased confidence in the estimates compared to the P3 2000 Study which was completed to a
pre-feasibility level. Costing was based on first principles and with a high degree of confidence given existing
operating experience. Since the completion of the P3 2000 Study, various projects have been completed including an
expansion of the tailings facility and clearing of the shaft site area. With the mill expansion area located on
bedrock, the bulk of the Phase 3+ earthworks have been completed. Combined with other projects completed and capital
contracted to date, and with there being far less unknowns with a brownfield expansion of an operating mine, the
project has been significantly de-risked.
Mining
Longitudinal long-hole open stoping will continue to be utilized as the primary mining method with both the
addition of the shaft and paste plant key elements to supporting the increase in mining rates to 2,400 tpd. Relative
to the P3 2000 Study, the paste plant has been sized with a 20% larger capacity, and $100 million of growth capital
has been brought forward from sustaining capital to be spent by 2026 to support the 20% higher mining rates. This
includes $70 million of accelerated development and $30 million for underground equipment and infrastructure.
Shaft
The main components of the shaft infrastructure are unchanged from the P3 2000 Study with the exception of the
addition of a bin house and hoist drive cooling building. The bin house will allow for a more efficient and lower
cost transfer of ore and waste to haul trucks on surface.
A 5.0 metre diameter concrete lined shaft will be constructed with a steel head frame. The shaft will house two 12
tonne skips in dedicated compartments for ore and waste movement, and a double-deck service cage for the transport
of personnel and materials. The shaft will be sunk to an initial depth of 1,373 metres. The hoisting plant is
designed for an ultimate depth of 2,000 metres providing flexibility to accommodate future exploration success. At
the initial depth of 1,373 metres, the shaft has a capacity of 4,500 tpd, more than sufficient to accommodate the
peak mining rates of 3,600 tpd (ore & waste).
A conventional blind sink methodology will be utilized providing improved schedule reliability with minimal impact
on existing operations. The underground ore and waste handling and loading pocket will be a conventional
configuration similar to that of Young-Davidson. Once skipped to surface, ore will be trucked to the expanded mill
circuit.
The total construction capital for the shaft installation including all supporting infrastructure is expected to be
$229 million.
Paste plant
As with the P3 2000 Expansion, a paste plant will be constructed; however, it will be sized 20% larger to
accommodate the higher mining rates. The addition of paste fill underground will allow for faster stope cycling,
thereby supporting higher mining rates and providing increased geotechnical stability. It will also increase mining
recovery resulting in an additional 140,000 ounces of gold recovered over the life of mine, with an in-situ value of
$231 million at a gold price of $1,650 per ounce. Further, 44% of tailings will be placed underground reducing
tailings dam raise requirements over the mine life.
The total capital for the paste plant including the underground distribution system is expected to be $52 million.
Mobile fleet
Mining rates are expected to begin ramping up from the current 1,200 tpd rate in 2025 and reach design rates of
2,400 tpd by the end of 2026. This will be supported by a significantly smaller mobile fleet than required under the
current ramp operation. Post completion of the shaft, a total of five haul trucks will be required to support a
mining rate of 2,400 tpd. This compares to a peak of 18 haul trucks required to sustain ramp haulage at 1,200 tpd.
This contributes to the lower ventilation requirements, and significantly lower diesel usage.
The Phase 3+ Expansion is expected to reduce GHG emissions by 35% over the life of mine while further reducing
Island Gold’s already industry-low GHG emissions per ounce by 31%.
A chart accompanying this announcement is available at https://www.globenewswire.com/NewsRoom/AttachmentNg/6928601d-cf64-4148-a00a-1617304cbdd7
Processing and Infrastructure
The P3 2000 mill expansion included upgrading the crushing circuit, adding a second parallel ball mill, and a new
elution and carbon in pulp (“CIP”) circuit with carbon screens. The P3+ mill expansion will increase the capacity to
2,400 tpd, double the current capacity of 1,200 tpd. The expanded circuit will be a conventional milling operation
with additional scope changes to accommodate the higher throughput rates. These include a new crushing circuit, a
covered stockpile, a larger ADR and the conversion of the existing CIP circuit to carbon in leach (“CIL”) while
adding three new tanks. The total cost of the mill expansion is expected to be $76 million.
Construction of a new mill was also evaluated; however, the capital cost was significantly higher in the current
environment, which more than offset its lower operating costs. The configuration of the expanded circuit also
provides greater operational flexibility with two parallel circuits.
The flow sheet of the new circuit includes upgrades and expansions for the following major process operations:
- New two-stage crushing plant
- New covered ore stockpile and feeders
- Additional ball mill and convert existing circuit to two trains
- Upgrade feed well on existing pre-leach thickener
- Convert existing five leach tanks to CIL and add three new larger CIL tanks
- New packaged 5t ADR plant
- New cyanide destruction circuit
Mill recoveries are expected to average 96.5% over the life of mine, consistent with the historical performance of
the existing operation.
To accommodate the increased electricity requirements with the larger mill and higher mining rates, the power line
will be upgraded to a peak capacity of 34 MW compared to 26 MW in the P3 2000 Study.
An expansion of the existing tailings impoundment area has already been completed with the current footprint
containing sufficient capacity with future raises to accommodate existing Mineral Reserves and Resources. Given the
43% increase in mineable resource, one additional tailings lift has been incorporated into the P3+ Expansion. The
next lift is scheduled for 2024.
An effluent treatment plant has also been incorporated into the P3+ Expansion at a cost of $16 million.
Operating Costs
Total cash costs are expected to average $425 per ounce and mine-site all-in sustaining costs $576 per ounce
following the completion of the shaft construction in 2026. These represent a 26% and 34% decrease, respectively
from the mid-point of 2022 guidance reflecting the significant productivity improvements, increased automation, and
higher throughput rates associated with a shaft-hoisting operation.
Costs are consistent with the P3 2000 Study with the productivity improvements and higher grades offsetting
inflation.
Total operating costs are expected to average C$178 per tonne of mill feed over the life of mine and C$174 per
tonne post completion of the expansion. This includes average mining costs of C$101 per tonne over the life of mine
and C$100 per tonne post completion of the expansion. The shaft will allow for unit mining costs to remain
relatively stable as mining moves deeper compared to ramp access mining where costs would continue to increase with
depth. This will help ensure Island Gold remains one of the lowest cost mines in the world over the long-term.
The breakdown of unit costs is summarized as follows.
|
(in C$/tonne)
|
P3 2000
1
|
P3+ 2400
|
| Mining (less
cap dev) |
$98 |
$101 |
| Milling |
$31 |
$35 |
| Admin |
$39 |
$37 |
| Subtotal
Operating Cost |
$168 |
$173 |
| Silver Credit |
-$1 |
-$1 |
| Royalties
|
$17 |
$6 |
|
Total Operating Cost (includes royalties)
|
$
184
|
$
178
|
Total Cash Cost (US$/oz)
2
- Average LOM |
$
443
|
$
432
|
Total Cash Cost (US$/oz)
2
- Average Post Project Completion |
$
422
|
$
425
|
Mine-site All-in Sustaining Costs (US$/oz)
2
- Average LOM |
$
627
|
$
610
|
Mine-site All-in Sustaining Costs (US$/oz)
2
- Average Post Project Completion |
$
559
|
$
576
|
1 The 2020 Phase 3 Expansion Study (P3 2000) has been normalized to the P3+ Expansion using a gold price
of $1,800/oz and USD/CAD foreign exchange rate of $0.79:1 from 2020-2022; and gold price of $1,650/oz and USD/CAD
foreign exchange rate of 0.78:1 2023 onward
2 Please refer to Cautionary Notes on non-GAAP Measures
and Additional GAAP Measures.
Royalty
Production from Island Gold is subject to third party net smelter return (“NSR”) royalties. The total effective NSR
royalty averages approximately 2.5% over the life of mine based on ounces produced. However, approximately 90% of
NSR royalties at Island Gold are paid in-kind (ounces) to a third party. The accounting treatment requires that
in-kind royalties be recorded at production cost which lowers royalty expense, with an offsetting reduction in
revenue given in-kind ounces transferred to royalty holders do not meet the definition of sales. As a result, the
average NSR included in the P3+ Study is approximately 0.9% of revenue over the life of mine. There is no net impact
on gross margin from the accounting for in-kind NSR royalties compared to cash-paid NSR royalties given the lower
royalty expense is offset by a reduction in ounces sold.
Capital Costs
The Phase 3+ Expansion has extended the mine life four years to 2039 for an 18 year mine life. Growth capital is
expected to total $756 million, an increase from the P3 2000 Study with the main drivers being the 43% increase in
the mineable resource, scope changes to support the 20% expansion, accelerated development to support the higher
mining rates, and inflation.
Approximately $100 million of sustaining capital has been brought forward from later in the mine life to be spent
in the expansion period from 2022 to 2026 to support the 20% higher mining rates. This includes $70 million of
accelerated development and $30 million for underground equipment and infrastructure.
Sustaining capital is expected to total $777 million over the life of mine. The majority of the increase from the
P3 2000 Study is related to increased capital development and underground infrastructure to accommodate the larger
mineable resource as well as one additional tailings lift.
Combined growth and sustaining capital are expected to total $1.5 billion over the life of mine, or $344 per ounce
produced. This represents a 4% decrease on a per ounce basis with the economies of scale from a larger operation and
increasing ounces per vertical metre driving lower capital intensity and stronger profitability.
Including operating costs and total capital, the all-in cost is expected to total $776 per ounce produced over the
life of mine, a 3% decrease from $802 per ounce in the P3 2000 Study.
A breakdown of the capital requirements for the Phase 3+ Expansion relative to P3 2000 is detailed as follows.
|
Total capital
(in US$ millions)
|
P3 2000
1
as of Jan 2020
|
P3+ 2400
as of Jan 2022
|
|
Growth capital
|
$538 |
$756 |
| |
|
|
|
Sustaining capital
|
$576 |
$777 |
|
|
|
|
|
Total capital
|
$
1,114
|
$
1,533
|
|
Total production – life of mine (000 oz)
|
3,104
|
4,460
|
|
Total capital per ounce produced (US$/oz)
1
|
$
359
|
$
344
|
1 Please refer to the Cautionary Notes on non-GAAP Measures and Additional GAAP Measures
Growth Capital (including indirects & contingency)
(in US$ millions)
|
P3 2000
1
as of Jan 2020
|
P3+ 2400
as of Jan 2022
|
|
Shaft Surface Complex |
34 |
59 |
|
Shaft |
184 |
170 |
|
Mill |
34 |
76 |
|
Paste Plant |
39 |
52 |
|
Power Upgrade |
14 |
24 |
|
Effluent Treatment Plant |
- |
16 |
|
General Indirect Costs |
5 |
64 |
|
Contingency |
55 |
55 |
|
Total Growth Capital
|
$
366
|
$
516
|
|
Underground Equipment & Infrastructure |
41 |
79 |
|
Accelerated Capital Development |
131 |
162 |
|
Total Growth Capital (including Accelerated Spend)
|
$
538
|
$
756
|
|
Total Growth Capital per ounce Produced (US$/oz)
2
|
$
173
|
$
169
|
1 The 2020 P3 2000 Study has been normalized to the P3+ Expansion using a gold price of $1,800/oz and
USD/CAD foreign exchange rate of $0.79:1 from 2020-2022; and gold price of $1,650/oz and USD/CAD foreign exchange
rate of 0.78:1 2023 onward
2 Please refer to the Cautionary Notes on non-GAAP Measures and Additional
GAAP Measures
A chart accompanying this announcement is available at https://www.globenewswire.com/NewsRoom/AttachmentNg/310eb2de-6c01-422b-a6f1-96a6e5a0d94f
|
Sustaining Capital
(in US$ millions)
|
P3 2000
1
as of Jan 2020
|
P3+ 2400
as of Jan 2022
|
| Tailings Lifts |
17 |
32 |
| Underground Infrastructure |
130 |
154 |
| Mobile Equipment |
112 |
112 |
| Delineation Drilling |
20 |
32 |
| Capital
Development |
292 |
436 |
|
Total Sustaining Capital
|
$
571
|
$
765
|
|
Reclamation |
5 |
12 |
|
Total (including Reclamation)
|
$
576
|
$
777
|
|
Total Sustaining Capital per ounce Produced (US$/oz)
2 |
$
186
|
$
174
|
1 The 2020 Phase 3 Expansion Study (P3 2000) has been normalized to the P3+ Expansion using a gold price
of $1,800/oz and USD/CAD foreign exchange rate of $0.79:1 from 2020-2022; and gold price of $1,650/oz and USD/CAD
foreign exchange rate of 0.78:1 2023 onward
2 Please refer to the Cautionary Notes on non-GAAP
Measures and Additional GAAP Measures
Updated Three Year Capital Outlook
The company-wide three year capital outlook is revised to reflect the increase in growth capital at Island Gold
over the next three years as detailed in the Phase 3+ Expansion Study. While 2022 capital remains unchanged, 2023 is
expected to increase by $60 million to between $280 and $320 million, and 2024 expected to increase by $60 million
to between $290 and $330 million.
There are no other significant changes to the Company’s three year production, total cash cost, or AISC guidance
arising from the Phase 3+ Expansion Study.
Taxes
Given existing tax pools, Island Gold is not expected to pay any significant cash taxes until 2027 assuming a
$1,650 per ounce gold price, after which the effective tax rate is expected to average approximately 32% including
federal tax and Ontario mining tax. With the significantly larger operation and higher profitability, taxes paid
under the P3+ Expansion are expected to increase to $1.0 billion over the life of mine, compared with $0.6 billion
under the P3 2000 study.
Permitting
The approval of the CPA in March 2022 was a significant permitting milestone allowing for the ramp up of
construction activities. This includes construction of the shaft and associated infrastructure which is currently
underway. The majority of remaining permitting requirements fall within the provincial government jurisdiction.
These include amendments to existing operational authorizations and new authorizations for construction related
activities.
A subsequent CPA will need to be filed for additional scope changes related to the Phase 3+ Expansion that were not
covered under the initial CPA. These include the effluent treatment plant, new paste plant location and other
changes to the surface infrastructure. Amendments to current Environmental Compliance Approvals will also be
required as the expansion moves forward.
Permitting activities fall within a well known jurisdiction where Alamos has successfully operated for years,
achieving various permitting milestones at both of its Young-Davidson and Island Gold mines.
Consultant Contributions
The Phase 3+ Expansion Study was consolidated by Alamos Gold’s technical team in collaboration with the following
third party consulting firms in their respective areas of expertise:
- Hatch: Overall Infrastructure Design/Engineering
- Redpath: Sinking Engineering & Design
- Paterson & Cook : Paste Fill Plant & UDS Design
- Airfinders: Ventilation Engineering
- Golder: Water Management & Tails Dam; and Environmental Baseline Monitoring & Permitting Support
- DRA/Halyard: Mill Expansion
Island Gold Phase 3+ Expansion Study Webcast
The Company will be hosting a technical session on Wednesday, June 29, 2022 at 8:30 am ET to
discuss the results of the Phase 3+ Expansion Study. Participants may join the webcast at www.alamosgold.com.
Technical Disclosure
Chris Bostwick, FAusIMM, Alamos Gold’s Senior Vice President, Technical Services, has reviewed and approved
the scientific and technical information contained in this news release. Mr. Bostwick is a Qualified
Person within the meaning of Canadian Securities Administrator's National Instrument 43-101 ("NI 43-101").
The Company will file a technical report prepared in accordance with NI 43-101 on SEDAR at www.sedar.com within 45 days of the date of this
release.
About Alamos
Alamos is a Canadian-based intermediate gold producer with diversified production from three operating mines in
North America. This includes the Young-Davidson and Island Gold mines in northern Ontario, Canada and the Mulatos
mine in Sonora State, Mexico. Additionally, the Company has a significant portfolio of development stage projects in
Canada, Mexico, Turkey, and the United States. Alamos employs more than 1,700 people and is committed to the highest
standards of sustainable development. The Company’s shares are traded on the TSX and NYSE under the symbol “AGI”.
FOR FURTHER INFORMATION, PLEASE CONTACT:
|
Scott K. Parsons
|
|
| Vice President, Investor Relations |
|
| (416) 368-9932 x 5439 |
|
| |
|
The TSX and NYSE have not reviewed and do not accept responsibility for the adequacy or accuracy of this
release.
All amounts are in United States dollars, unless otherwise stated.
Cautionary Note
This news release contains or incorporates by reference “forward-looking statements” and
“forward-looking information” as defined under applicable Canadian and U.S. securities laws. All statements, other
than statements of historical fact, which address events, results, outcomes or developments that the Company expects
to occur are, or may be deemed to be, forward-looking statements and are generally, but not always, identified by
the use of forward-looking terminology such as "expect", “is expected”, “assume”, “believe”, “anticipate”, “intend”,
“inferred”, “potential”, "will", “plan”, “planned”, “outlook”, “estimates”, “estimated”, “continue”, “ongoing”
“forecast”, “budget”, “target” or variations of such words and phrases and similar expressions or statements that
certain actions, events or results “may", “could”, “would”, "might" or "will" be taken, occur or be achieved or the
negative connotation of such terms. Forward-looking statements contained in this news release are based on
expectations, estimates and projections as of the date of this news release.
Forward-looking statements in this news release include, but may not be limited to, information as
to strategy, plans, expectations or future financial or operating performance, such as expectations and guidance
regarding: costs; budgets; capital expenditures, growth capital, sustaining capital; production growth; returns to
stakeholders; the effects of the Phase III expansion at Island Gold and timing of its progress and completion;
anticipated gold production and production rates; mining processing and rates; mined and processed gold grades and
weights; mine life; tax rates and timing of payment of certain taxes; GHG emission intensity; value of operation;
effects on profitability; project-related risks as well as any other statements related to the Company's production
forecasts and plans, expected sustaining costs, expected improvements in cash flows and margins, expectations of
changes in capital expenditures, expansion plans, project timelines, and expected sustainable productivity
increases, expected increases in mining activities and corresponding cost efficiencies, cost estimates, sufficiency
of working capital for future commitments, Mineral Reserve and Mineral Resource estimates, and other statements that
express management's expectations or estimates of future performance.
The Company cautions that forward-looking statements are necessarily based upon a number of factors
and assumptions that, while considered reasonable by management at the time of making such statements, are
inherently subject to significant business, economic, technical, legal, political and competitive uncertainties and
contingencies. Known and unknown factors could cause actual results to differ materially from those projected in the
forward-looking statements, and undue reliance should not be placed on such statements and information.
Such factors and assumptions underlying the forward-looking statements in this news release,
include, but are not limited to: changes to current estimates of Mineral Reserves and Resources; changes to
production estimates (which assume accuracy of projected ore grade, mining rates, recovery timing and recovery rate
estimates and may be impacted by unscheduled maintenance, weather issues, labour and contractor availability and
other operating or technical difficulties); operations may be exposed to new diseases, epidemics and pandemics,
including the continued and potential effects of COVID-19 and its impact on the broader market and the trading price
of the Company’s shares; provincial, state and federal orders or mandates (including with respect to mining
operations generally or auxiliary businesses or services required for the Company’s operations) in Canada, Mexico,
the United States and Turkey; the duration of regulatory responses to COVID-19 and government and the Company’s
attempts to reduce the spread of COVID-19 which may affect many aspects of the Company’s operations including the
ability to transport personnel to and from site, contractor and supply availability and the ability to sell or
deliver gold doré bars; fluctuations in the price of gold or certain other commodities such as, diesel fuel, natural
gas and electricity; changes in foreign exchange rates (particularly the Canadian dollar, U.S. dollar, Mexican peso
and Turkish Lira); the impact of inflation; changes in the Company’s credit rating; any decision to declare a
dividend; employee and community relations; labour and contractor availability (and being able to secure the same on
favourable terms); litigation and administrative proceedings; disruptions affecting operations; expansion or
construction delays with the Phase III expansion project at the Island Gold mine availability of and increased costs
associated with mining inputs and labour; inherent risks and hazards associated with mining and mineral processing
including environmental hazards, industrial accidents, unusual or unexpected formations, pressures and cave-ins; the
risk that the Company’s mines may not perform as planned; uncertainty with the Company's ability to secure
additional capital to execute its business plans; the speculative nature of mineral exploration and development,
including the risks of obtaining and maintaining necessary licenses, permits and authorizations, contests over title
to properties; expropriation or nationalization of property; political or economic developments in Canada, Mexico,
the United States, Turkey and other jurisdictions in which the Company may carry on business in the future;
increased costs and risks related to the potential impact of climate change; changes in national and local
government legislation, controls or regulations (including tax and employment legislation) in jurisdictions in
which the Company does or may carry on business in the future; the costs and timing of construction and development
of new deposits; risk of loss due to sabotage, protests and other civil disturbances; disruptions in the maintenance
or provision of required infrastructure and information technology systems, the impact of global liquidity and
credit availability and the values of assets and liabilities based on projected future cash flows; risks arising
from holding derivative instruments; and business opportunities that may be pursued by the Company.
For a more detailed discussion of such risks and other factors that may affect the Company's
ability to achieve the expectations set forth in the forward-looking statements contained in this news release, see
the Company’s latest 40-F/Annual Information Form and Management’s Discussion and Analysis, each under the heading
“Risk Factors” available on the SEDAR website at www.sedar.com or on EDGAR at www.sec.gov. The foregoing should be reviewed in conjunction with the information
and risk factors and assumptions found in this news release.
The Company disclaims any intention or obligation to update or revise any forward-looking
statements whether as a result of new information, future events or otherwise, except as required by applicable
law.
Cautionary Note to U.S. Investors
Alamos prepares its disclosure in accordance with the requirements of securities laws in effect in
Canada. Unless otherwise indicated, all Mineral Resource and Mineral Reserve estimates included in this document
have been prepared in accordance with National Instrument 43-101 - Standards of Disclosure for Mineral Projects (“NI
43-101”) and the Canadian Institute of Mining, Metallurgy and Petroleum (the “CIM”) - CIM Definition Standards on
Mineral Resources and Mineral Reserves, adopted by the CIM Council, as amended (the “CIM Standards”). NI 43-101 is a
rule developed by the Canadian Securities Administrators, which established standards for all public disclosure an
issuer makes of scientific and technical information concerning mineral projects. Mining disclosure in the United
States was previously required to comply with SEC Industry Guide 7 (“SEC Industry Guide 7”) under the United States
Securities Exchange Act of 1934, as amended. The U.S. Securities and Exchange Commission (the “SEC”) has adopted
final rules, to replace SEC Industry Guide 7 with new mining disclosure rules under sub-part 1300 of Regulation S-K
of the U.S. Securities Act (“Regulation S-K 1300”) which became mandatory for U.S. reporting companies beginning
with the first fiscal year commencing on or after January 1, 2021. Under Regulation S-K 1300, the SEC now recognizes
estimates of “Measured Mineral Resources”, “Indicated Mineral Resources” and “Inferred Mineral Resources”. In
addition, the SEC has amended its definitions of “Proven Mineral Reserves” and “Probable Mineral Reserves” to be
substantially similar to international standards.
Investors are cautioned that while the above terms are “substantially similar” to CIM Definitions,
there are differences in the definitions under Regulation S-K 1300 and the CIM Standards. Accordingly, there is no
assurance any mineral reserves or mineral resources that the Company may report as “proven mineral reserves”,
“probable mineral reserves”, “measured mineral resources”, “indicated mineral resources” and “inferred mineral
resources” under NI 43-101 would be the same had the Company prepared the mineral reserve or mineral resource
estimates under the standards adopted under Regulation S-K 1300. U.S. investors are also cautioned that while the
SEC recognizes “measured mineral resources”, “indicated mineral resources” and “inferred mineral resources” under
Regulation S-K 1300, investors should not assume that any part or all of the mineralization in these categories will
ever be converted into a higher category of mineral resources or into mineral reserves. Mineralization described
using these terms has a greater degree of uncertainty as to its existence and feasibility than mineralization that
has been characterized as reserves. Accordingly, investors are cautioned not to assume that any measured mineral
resources, indicated mineral resources, or inferred mineral resources that the Company reports are or will be
economically or legally mineable.
Cautionary non-GAAP Measures and Additional GAAP Measures
Note that for purposes of this section, GAAP refers to IFRS. The Company believes that investors
use certain non-GAAP and additional GAAP measures as indicators to assess gold mining companies. They are intended
to provide additional information and should not be considered in isolation or as a substitute for measures of
performance prepared with GAAP.
“Cash flow from operating activities before changes in non-cash working capital” is a non-GAAP
performance measure that could provide an indication of the Company’s ability to generate cash flows from
operations, and is calculated by adding back the change in non-cash working capital to “Cash provided by (used in)
operating activities” as presented on the Company’s consolidated statements of cash flows. “Free cash flow” is a
non-GAAP performance measure that is calculated as cash flows from operations net of cash flows invested in mineral
property, plant and equipment and exploration and evaluation assets as presented on the Company’s consolidated
statements of cash flows and that would provide an indication of the Company’s ability to generate cash flows from
its mineral projects. “Mine site free cash flow” is a non-GAAP measure which includes cash flow from operating
activities at, less capital expenditures at each mine site. Return on Equity is defined as Earnings from Continuing
Operations divided by the average Total Equity for the current and previous year. “Mining cost per tonne of ore” and
“Cost per tonne of ore” are non-GAAP performance measures that could provide an indication of the mining and
processing efficiency and effectiveness of the mine. These measures are calculated by dividing the relevant mining
and processing costs and total costs by the tonnes of ore processed in the period. “Cost per tonne of ore” is
usually affected by operating efficiencies and waste-to-ore ratios in the period. “Total capital expenditures per
ounce produced” is a non-GAAP term used to assess the level of capital intensity of a project and is calculated by
taking the total growth and sustaining capital of a project divided by ounces produced life of mine. “Total cash
costs per ounce”, “all-in sustaining costs per ounce”, “mine-site all-in sustaining costs”, and “all-in costs per
ounce” as used in this analysis are non-GAAP terms typically used by gold mining companies to assess the level of
gross margin available to the Company by subtracting these costs from the unit price realized during the period.
These non-GAAP terms are also used to assess the ability of a mining company to generate cash flow from operations.
There may be some variation in the method of computation of these metrics as determined by the Company compared with
other mining companies. In this context, “total cash costs” reflects mining and processing costs allocated from
in-process and doré inventory associated and associated royalties with ounces of gold sold in the period. Total cash
costs per ounce are exclusive of exploration costs. “All-in sustaining costs per ounce” include total cash costs,
exploration, corporate and administrative, share based compensation and sustaining capital costs. “Mine-site all-in
sustaining costs” include total cash costs, exploration, and sustaining capital costs for the mine-site, but exclude
an allocation of corporate and administrative and share based compensation.
Additional GAAP measures that are presented on the face of the Company’s consolidated statements of
comprehensive income and are not meant to be a substitute for other subtotals or totals presented in accordance with
IFRS, but rather should be evaluated in conjunction with such IFRS measures. This includes “Earnings from
operations”, which is intended to provide an indication of the Company’s operating performance, and represents the
amount of earnings before net finance income/expense, foreign exchange gain/loss, other income/loss, and income tax
expense. Non-GAAP and additional GAAP measures do not have a standardized meaning prescribed under IFRS and
therefore may not be comparable to similar measures presented by other companies. A reconciliation of historical
non-GAAP and additional GAAP measures are available in the Company’s latest Management’s Discussion and Analysis
available online on the SEDAR website at www.sedar.com or on EDGAR at www.sec.gov and at www.alamosgold.com.
Table 1: Phase 3+ Expansion Production Schedule
|
|
2022
|
2023
|
2024
|
2025
|
2026
|
2027
|
2028
|
2029
|
2030
|
2031
|
2032
|
2033
|
2034
|
2035
|
2036
|
2037
|
2038
|
2039
|
|
Mill Feed mined (000’s tonnes)
|
438 |
438 |
439 |
479 |
699 |
876 |
878 |
876 |
876 |
876 |
878 |
876 |
876 |
876 |
878 |
875 |
874 |
542 |
|
Waste mined (000’s tonnes)
|
493 |
579 |
647 |
676 |
537 |
393 |
393 |
370 |
427 |
412 |
376 |
227 |
219 |
229 |
122 |
81 |
0 |
0 |
|
Total tonnes mined (000’s)
|
931 |
1,017 |
1,086 |
1,155 |
1,236 |
1,269 |
1,272 |
1,246 |
1,303 |
1,288 |
1,255 |
1,103 |
1,095 |
1,105 |
1,000 |
956 |
874 |
542 |
|
Grades (g/t Au)
|
9.73 |
9.40 |
11.29 |
12.47 |
10.45 |
10.46 |
10.12 |
11.66 |
11.79 |
12.81 |
11.73 |
10.27 |
11.94 |
10.16 |
9.78 |
9.32 |
8.73 |
7.34 |
|
Gold production (oz)
|
132,414 |
127,790 |
153,828 |
185,287 |
232,577 |
284,401 |
275,792 |
317,015 |
320,326 |
348,148 |
319,683 |
279,249 |
324,615 |
276,227 |
266,537 |
253,014 |
236,529 |
126,766 |
|
Gold Sales (oz)
|
129,957 |
125,446 |
151,285 |
181,818 |
227,541 |
277,060 |
268,075 |
309,146 |
312,241 |
340,991 |
312,693 |
273,071 |
316,232 |
270,199 |
261,582 |
247,917 |
231,662 |
124,403 |
|
Operating costs
|
|
|
|
|
|
|
|
|
|
|
|
|
|
|
|
|
|
|
|
Unit mining costs (C$/tonne)
|
$106 |
$109 |
$100 |
$112 |
$114 |
$95 |
$96 |
$95 |
$94 |
$97 |
$98 |
$103 |
$103 |
$103 |
$106 |
$107 |
$96 |
$101 |
|
Unit milling costs (C$/tonne)
|
$38 |
$38 |
$39 |
$37 |
$33 |
$34 |
$34 |
$35 |
$35 |
$35 |
$35 |
$34 |
$34 |
$34 |
$34 |
$34 |
$34 |
$31 |
|
Unit G&A costs (C$/tonne)
|
$52 |
$46 |
$46 |
$44 |
$36 |
$35 |
$35 |
$35 |
$34 |
$34 |
$35 |
$37 |
$37 |
$37 |
$38 |
$39 |
$33 |
$36 |
|
Total unit operating costs
2
(C$/tonne)
|
$202 |
$199 |
$190 |
$199 |
$181 |
$169 |
$169 |
$169 |
$167 |
$171 |
$172 |
$179 |
$179 |
$179 |
$183 |
$185 |
$166 |
$172 |
|
Total cash costs (US$/oz)
1
|
$539 |
$542 |
$431 |
$408 |
$461 |
$416 |
$431 |
$374 |
$365 |
$342 |
$378 |
$448 |
$387 |
$452 |
$480 |
$508 |
$489 |
$584 |
|
Mine-site AISC (US$/oz)
1
|
$833 |
$964 |
$813 |
$733 |
$696 |
$641 |
$645 |
$577 |
$553 |
$496 |
$521 |
$579 |
$530 |
$577 |
$584 |
$585 |
$507 |
$681 |
|
Capital expenditures
|
|
|
|
|
|
|
|
|
|
|
|
|
|
|
|
|
|
|
|
Sustaining capex (US$ M)
|
$38 |
$53 |
$58 |
$59 |
$54 |
$62 |
$57 |
$63 |
$58 |
$52 |
$45 |
$36 |
$45 |
$34 |
$27 |
$19 |
$4 |
$12 |
|
Growth capex (US$ M)
|
$168 |
$183 |
$187 |
$168 |
$48 |
$0 |
$0 |
$0 |
$0 |
$0 |
$0 |
$0 |
$0 |
$0 |
$0 |
$0 |
$0 |
$0 |
1
Please refer to Cautionary Notes on non-GAAP Measures and Additional GAAP Measures.
2
Total unit operating costs are inclusive of royalties and silver credits


Source: Alamos Gold Inc.